The best visual content types to explain the build vs. buy decision
Feb 11, 2025
Companies want the best features to offer their customers. But should they buy or build? The choice is critical. It impacts budgets, timelines, and long-term success.
As a software provider, you obviously want people to choose to buy your software rather than building their own. But how do you explain the options?
That’s where the right visual content comes in.
By structuring Build vs Buy content strategically, you can simplify the decision-making process and clearly communicate your case.
Here are some of the best visual content types we’ve seen to help companies explain the build vs. buy dilemma, along with tips on how to structure them for maximum impact.
1. Side-by-Side Comparisons
Side by sides make it easy to compare specific features.
How to structure:
- Headline: Clearly label the comparison, e.g., “Building In-House vs. Buying External Solutions.”
- Columns: Create two columns for “Build” and “Buy.”
- Key Categories: Include cost, expertise, scalability, time to market, and long-term maintenance as rows in the table.
- Visual Enhancements: Use icons or checkmarks to make benefits stand out at a glance.
Why it works: It’s straightforward, visual, and gives decision-makers an easy way to weigh their options at a glance.
2. Explainer Videos
Explainer videos are powerful for turning abstract ideas into engaging narratives.
How to structure:
- Opening (10-15 seconds): Start with a clear statement of the problem, like, “You need a new product. Should you build it in-house or buy from an external provider?”
- Middle (60-90 seconds): Use motion graphics to:
- Illustrate timelines for both options.
- Show financial comparisons with animated charts.
- Highlight risks, such as resource bottlenecks for building or dependency risks for buying.
- Closing (15 seconds): End with a call to action, like: “Want to make the right decision? Here’s how we can help.”
Why it works: The combination of visuals, narration, and storytelling ensures your audience stays engaged while absorbing key information.
3. Infographics
Infographics simplify data-heavy aspects of the build vs. buy decision into clear visuals.
How to structure:
- Title: Start with a clear headline like “Build vs. Buy: A Cost Breakdown.”
- Sections: Divide the infographic into key comparison areas (e.g., costs, timelines, risks).
- Visual Hierarchy: Use bold icons and large numbers to emphasize key stats, like percentage savings or time differences.
- Flow: Arrange the information in a logical sequence—e.g., costs at the top, risks in the middle, and conclusion at the bottom.
Why it works: Infographics are highly shareable and give stakeholders a visual summary they can refer back to easily.
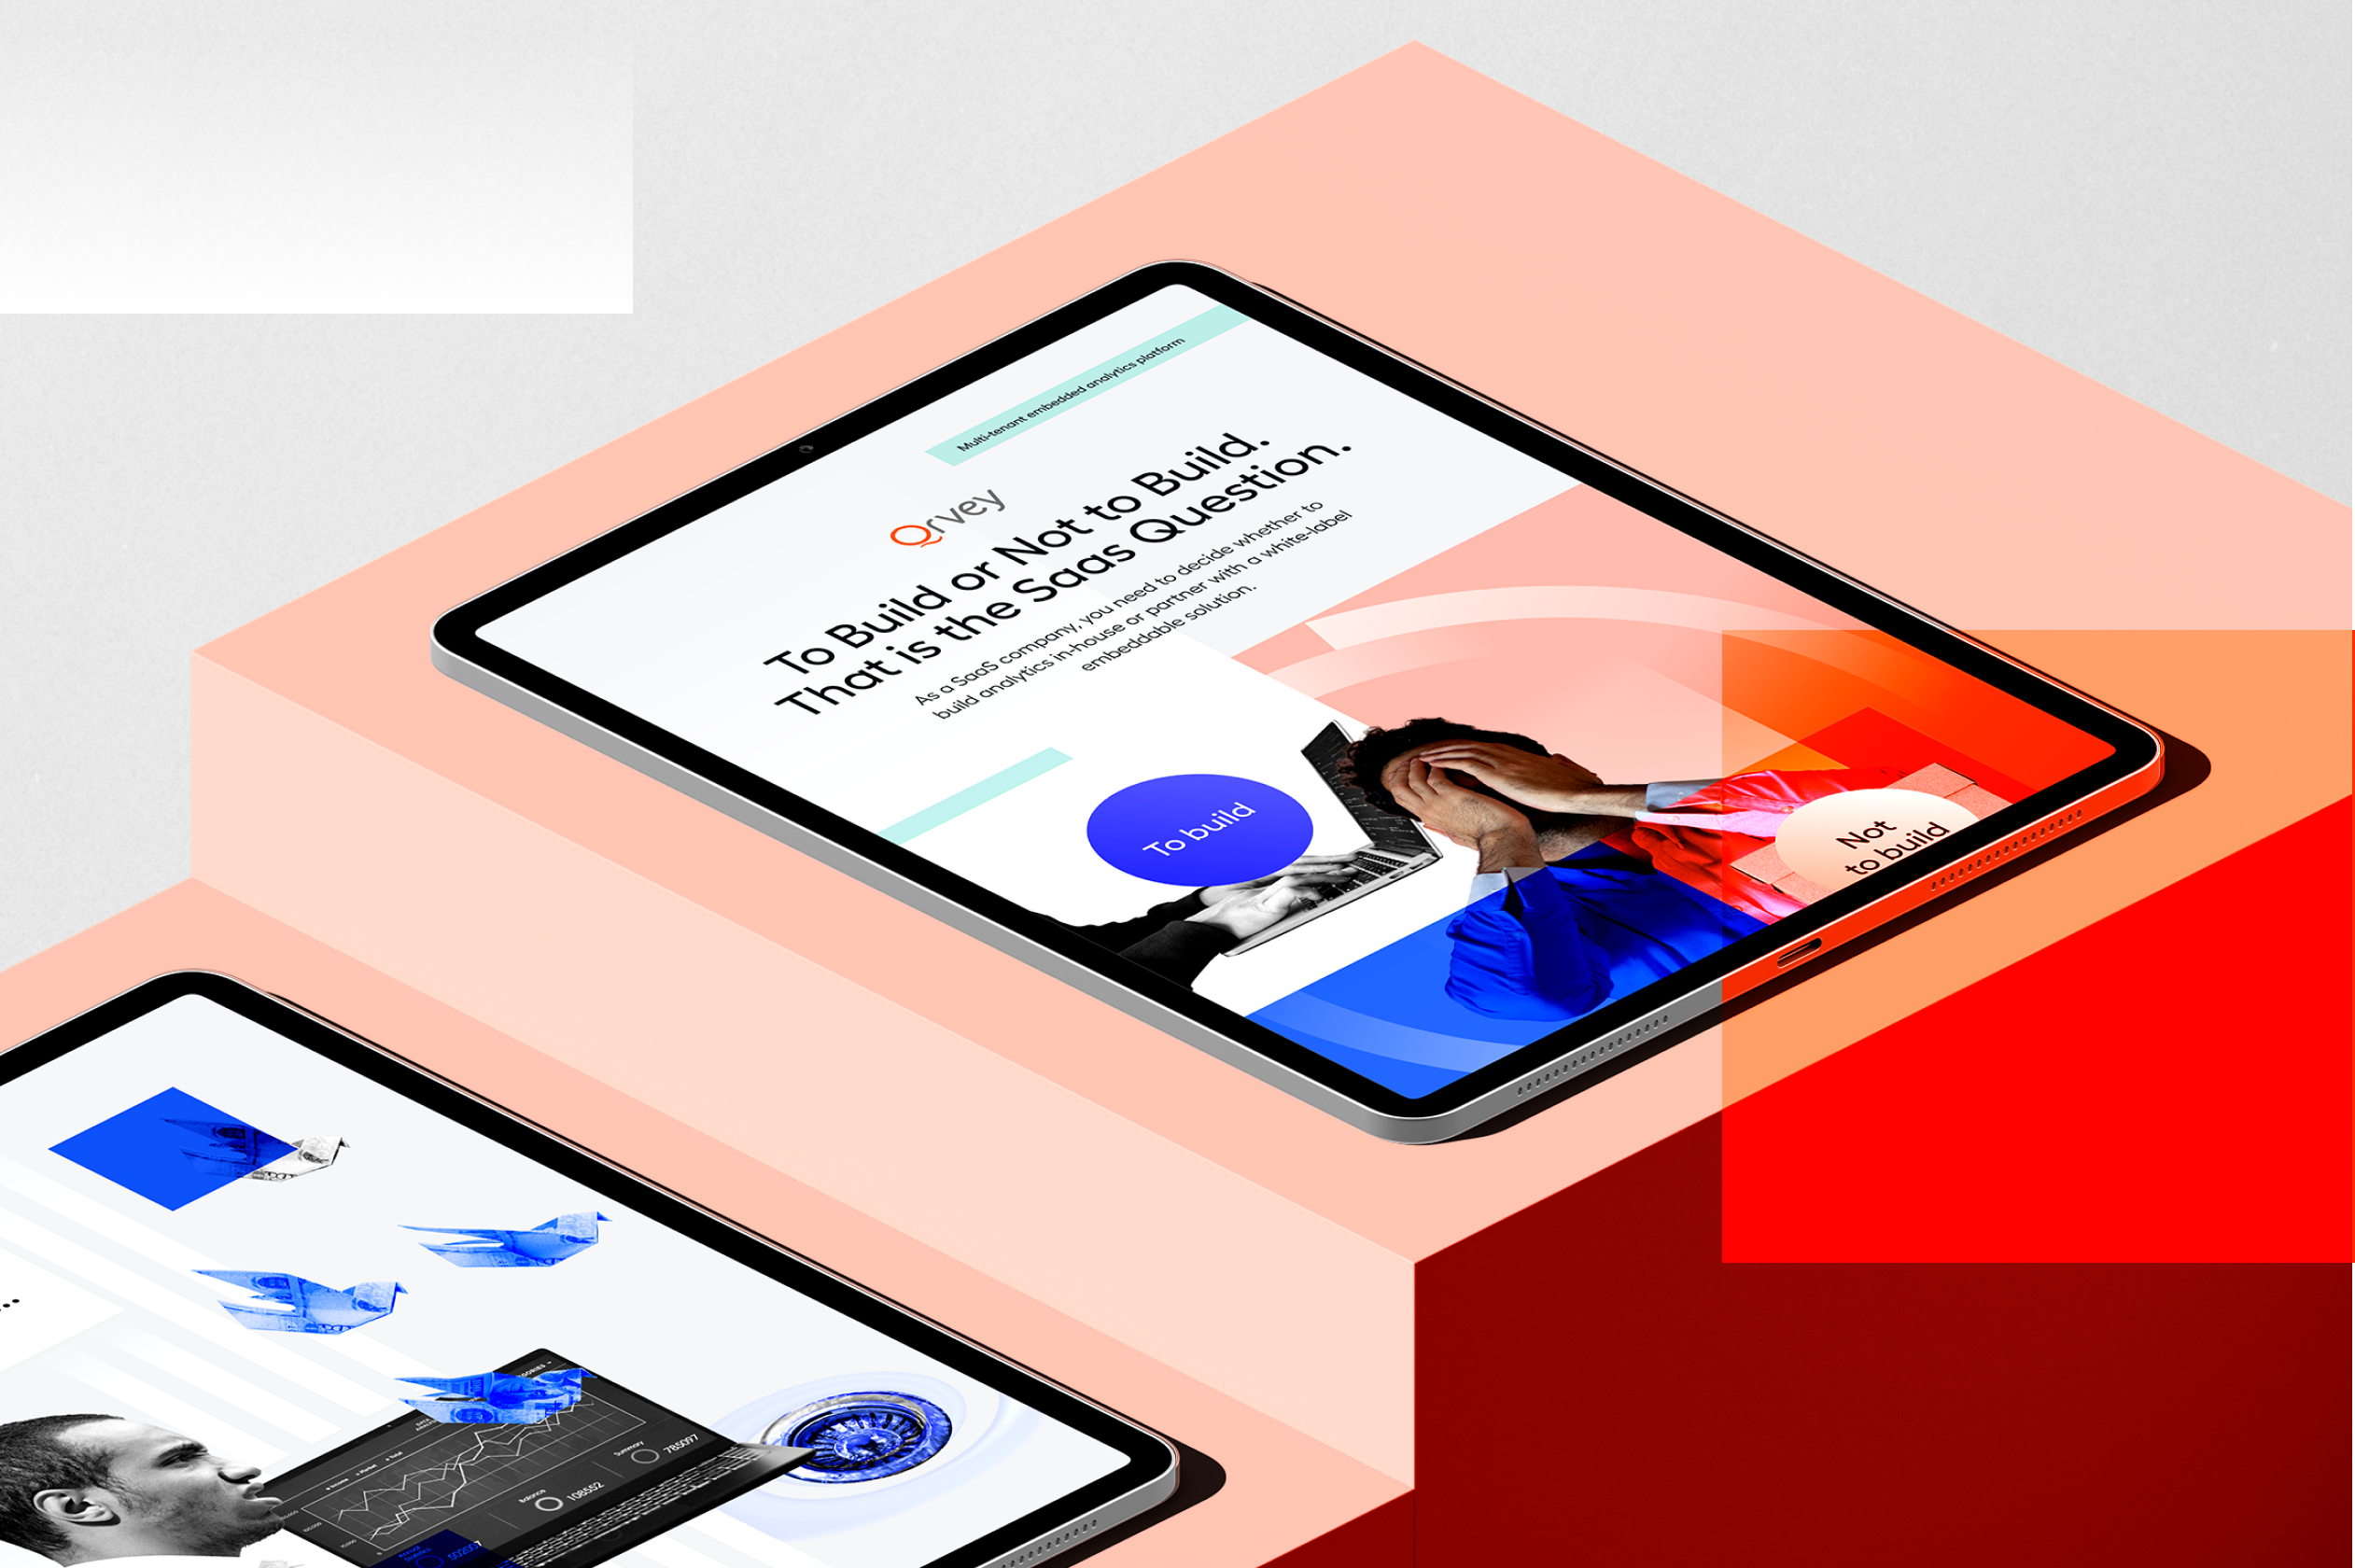
Infographic we did for client Qrvey
4. Interactive Decision Tools
Interactive tools like decision trees or calculators allow your audience to engage with the build vs. buy decision based on their specific circumstances.
How to structure:
- Intro Page: Frame the tool with a short question, like “Should you build or buy? Let’s find out.”
- Decision Tree Structure: Use branching paths with simple yes/no questions, such as “Do you have an in-house team with the required expertise?”
- Calculator Output: Provide a clear, customized recommendation at the end, e.g., “Based on your inputs, buying is 25% faster and 30% more cost-effective.”
Why it works: Interactive tools feel personalized and actionable, helping your audience make decisions confidently.
5. Case Studies with Visual Storytelling
Case studies add credibility by showing how others navigated the build vs. buy dilemma.
How to structure:
- Title: Start with a compelling headline, e.g., “How [Company] Saved 30% by Outsourcing.”
- Challenge: Outline the company’s situation, emphasizing their dilemma.
- Solution: Use a side-by-side visual to show why they chose to build or buy.
- Results: Highlight the outcome using charts or metrics, such as cost savings, reduced time to market, or improved scalability.
Why it works: People connect with real-world examples, especially when paired with visuals that make the story memorable.
Bottom Line
When it comes to explaining the build vs. buy decision, structured visual content can make all the difference. Whether it’s a quick comparison chart or an engaging explainer video, each asset should be tailored to your audience’s needs and preferences.
About Gallery Design Studio (GDS)
Content can mean a lot of things—we make it visual first.
For over a decade, we’ve partnered with AI-driven B2B tech leaders to turn complicated tech products into clear, engaging visual content that your audience can actually “get.” Whether it’s software, systems, or solutions, we help you communicate your product’s brilliance with clarity and impact—so you can focus on what’s next. Learn more here.


